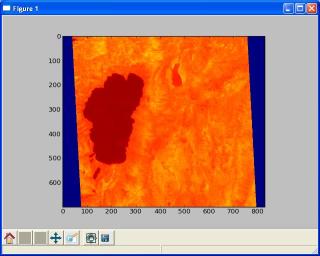
The usage examples below focus on how to work with datasets from airborne and satellite sensors stored in HDF4.x format with ``pyhdf``. These datasets are not included in the distribution.
Example 1. Opening an ASTER Surface Temperature Image

Lake Tahoe, CA/NV USA
Step-by-step instructions
a. Open a python command prompt
b. import Numpy
In [1]: from numpy import *
c. import the SD package from pyHDF
In [2]: from pyhdf.SD import SD, SDC
d. Open the ASTER file
In [3]: astsd = SD('AST_08_00312022006060651_20070103125725_32653.hdf', SDC.READ)
e. See what datasets are present in the file
In [4]: astsd.datasets()
which should return:
Out [4]:
{'GeodeticLatitude': (('GeoTrack:SurfaceKineticTemperature',
                       'GeoXtrack:SurfaceKineticTemperature'),
                      (11, 11),
                      6,
                      3),
 'KineticTemperature': (('ImageLine:SurfaceKineticTemperature',
                         'ImagePixel:SurfaceKineticTemperature'),
                        (700, 830),
                        23,
                        0),
 'Longitude': (('GeoTrack:SurfaceKineticTemperature',
                'GeoXtrack:SurfaceKineticTemperature'),
               (11, 11),
               6,
               4),
 'QA_DataPlane': (('ImageLine:SurfaceKineticTemperature',
                   'ImagePixel:SurfaceKineticTemperature'),
                  (700, 830),
                  21,
                  1),
 'QA_DataPlane2': (('ImageLine:SurfaceKineticTemperature',
                    'ImagePixel:SurfaceKineticTemperature'),
                   (700, 830),
                   23,
                   2)}

In [5]:
Details on what is included in ASTER product are available from the ASTER homepage. In this case we want to read in the kinetic temperature image, which is a 700x830 array:
In [6]: kt = astsd.select('KineticTemperature')
Now lets look at the image. You could extract a particular area in the array with:
In [7]: kt[300,50:150]
This will return
Out [7]:
array([2000, 2000, 2000, 2000, 2000, 2692, 2698, 2688, 2689, 2692, 2693,
       2694, 2680, 2694, 2687, 2692, 2697, 2702, 2698, 2693, 2696, 2692,
       2689, 2682, 2674, 2692, 2694, 2708, 2717, 2720, 2724, 2722, 2725,
       2721, 2711, 2701, 2706, 2734, 2762, 2803, 2817, 2799, 2798, 2801,
       2803, 2802, 2802, 2802, 2804, 2804, 2803, 2803, 2804, 2807, 2804,
       2805, 2808, 2806, 2806, 2806, 2806, 2803, 2805, 2825, 2807, 2806,
       2805, 2806, 2805, 2806, 2805, 2805, 2806, 2804, 2804, 2804, 2804,
       2805, 2805, 2803, 2805, 2804, 2802, 2802, 2801, 2802, 2801, 2801,
       2801, 2801, 2801, 2800, 2801, 2799, 2799, 2800, 2802, 2798, 2801,
       2800], dtype=uint16)
The values listed are temperatures in Kelvin * 10 ((273.15 + tempC)*10). The first few values are fill values (2000). The last few values are all over water and around 2800 or 280K (6.85 C).
or you can find the dimensions of the image with:
In [8]: kt.dimensions()
which returns:
Out [8]:
{'ImageLine:SurfaceKineticTemperature': 700,
 'ImagePixel:SurfaceKineticTemperature': 830}
to find out what functions are available with the kt dataset, type:
In [9]: dir(kt)
which returns:
Out [9]:
['_SDS__buildStartCountStride',
 '__class__',
 '__del__',
 '__delattr__',
 '__dict__',
 '__doc__',
 '__getattr__',
 '__getattribute__',
 '__getitem__',
 '__hash__',
 '__init__',
 '__len__',
 '__module__',
 '__new__',
 '__reduce__',
 '__reduce_ex__',
 '__repr__',
 '__setattr__',
 '__setitem__',
 '__str__',
 '__weakref__',
 '_id',
 '_sd',
 'attr',
 'attributes',
 'checkempty',
 'dim',
 'dimensions',
 'endaccess',
 'get',
 'getcal',
 'getcompress',
 'getdatastrs',
 'getfillvalue',
 'getrange',
 'info',
 'iscoordvar',
 'isrecord',
 'ref',
 'set',
 'setcal',
 'setcompress',
 'setdatastrs',
 'setexternalfile',
 'setfillvalue',
 'setrange']
The image can now be displayed using a visualization program, such as matplotlib, using the following code:
from matplotlib.pyplot import imshow
imshow(kt.get())
This should display the image shown at the top of the page.